Mapping Electric Plants Using the EIA API
Mapping Electicity Plants
I have been trying to gain a better understanding of where the electricity that enters my home originates. As part of that, I began exploring the U.S. Energy Administration's API which provides a wide variety of US energy data. In a post from earlier this month, I describe the Python code available on GitHub that I wrote to access that API. In this post, I describe an addition to that code that maps all of the electric plants within a region and indicates by color and size the type of fuel used and nameplate capacity respectively at each plant.
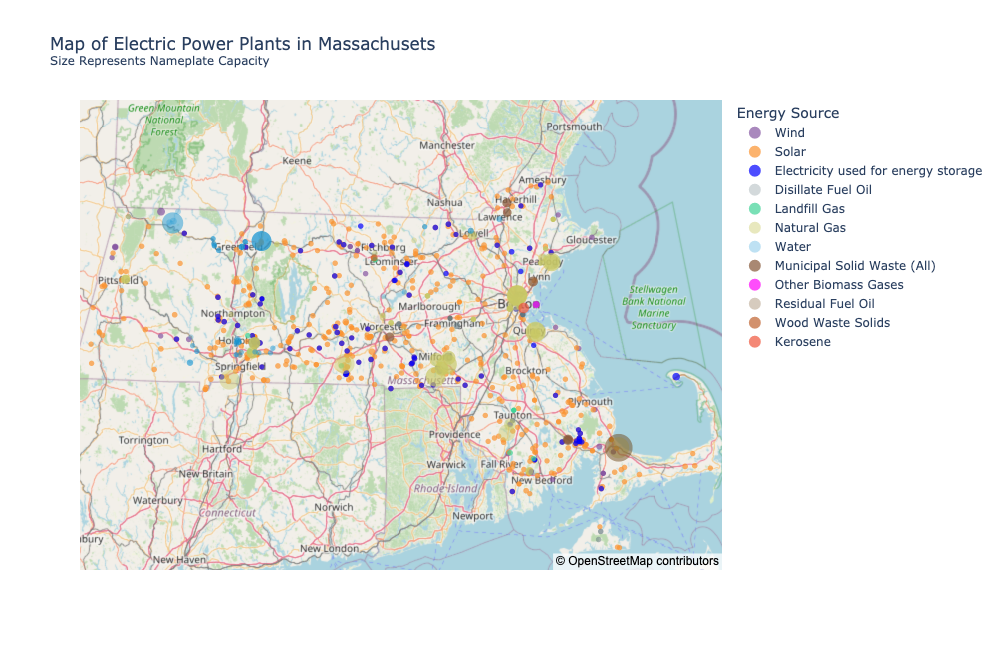
The code addition is a method in the Eia class called map_electric_plants. It takes a region specified by a list of facets (see my earlier post for a dicussion of facets) and outputs both static (PNG) and dynamic (HTML) Plotly Express scatter_mapbox images. Below is an example of a static map of the electric plants in Massachusetts.
And here is a dynamic version of the same map.
Along with the Eia class (available here) that I defined, the code I used to generate the above two maps is
data_getter = eia.Eia()
data_getter.map_electric_plants(facets={'stateid':['MA']}, mapbox=False, open_street=True,
                                static_fig_title="Map of Electric Power Plants in Massachusets<br><sup>Size Represents Nameplate Capacity</sup>",
                                dynamic_fig_title="Map of Electric Power Plants in Massachusets<br><sup>Size Represents Nameplate Capacity<br>(hover for details)</sup>")
OpenStreetMap vs Mapbox
The maps above use OpenStreetMap map data as the base map. This is the default and convenient since OpenStreetMap does not require an API token.
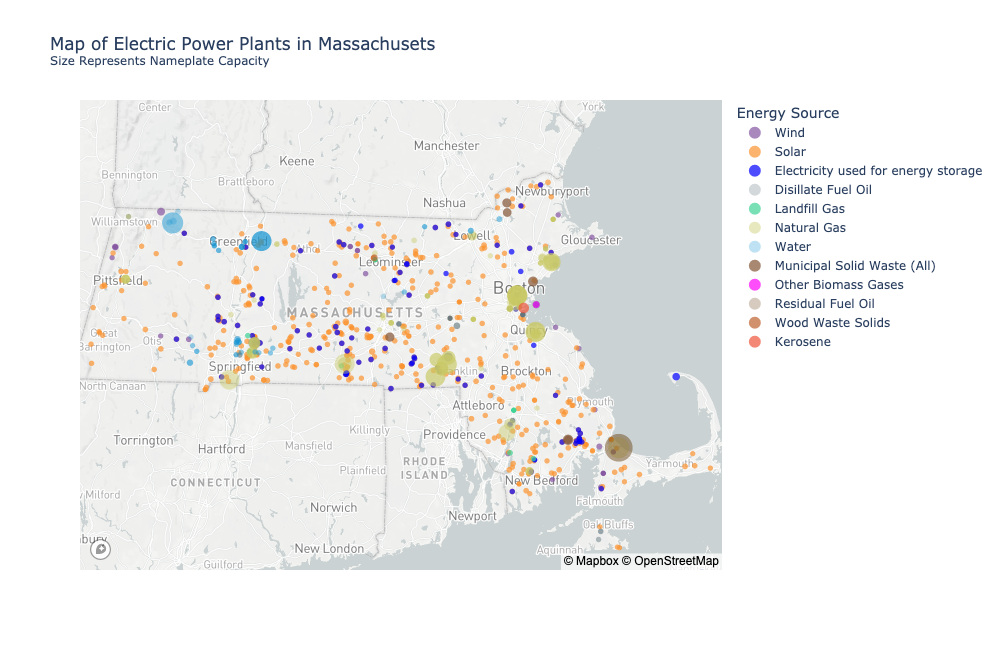
It is also possible to use Mapbox map data by setting the mapbox flag in Eia.map_electric_plants to True as long as you have a Mapbox API token. To register for one just create an account with Mapbox. Once you have the token, add it to the api_json file as described in the README of my EIA repository before running Eia.map_electric_plants.
Here is what the static map from above looks like using Mapbox.
And here is a dynamic version of the Mapbox map.
Keyword Args
EIA.map_electric_plants takes several key word arguments. I describe each below:
facets: This is a dictionary of facets used to define the region of interest. In the examples abovefacets={'stateid':['MA']}. You could produce a map of all New England States withfacets={'stateid':['MA', "NH", "CT", "ME", "VT", "RI"]}start: You can pretty much ignore this. The call to the EIA API needs a start date for the data it retrieves. Since the method uses only the latest reporting period, you should not need to change the default.open_street: If True (the default), it uses OpenStreetMap underlying map data.mapbox: If True (not the default), it uses Mapbox data and requires a Mapbox API token (see the README).dynamic_fig_title: The title to appear on the dynamic, interactive mapstatic_fig_title: The title to appear on the static mapinit_zoom: The initial zoom level of the interactive map. The default is 7. You may need to adjust it depending on the size of the region.open_street_file_name: The file name (without suffix) to give to a map using OpenStreetMap data. The suffix is added automatically depending on whether it's dynamic (.html) or static (.png)mapbox_file_name: Just like the above but with regard to Mapboxstatic_width: The width of the static image. You may need to adjust from the default depending on the region.static_height: The height of the static image. You may need to adjust from the default depending on the region.
Another Example - All of New England
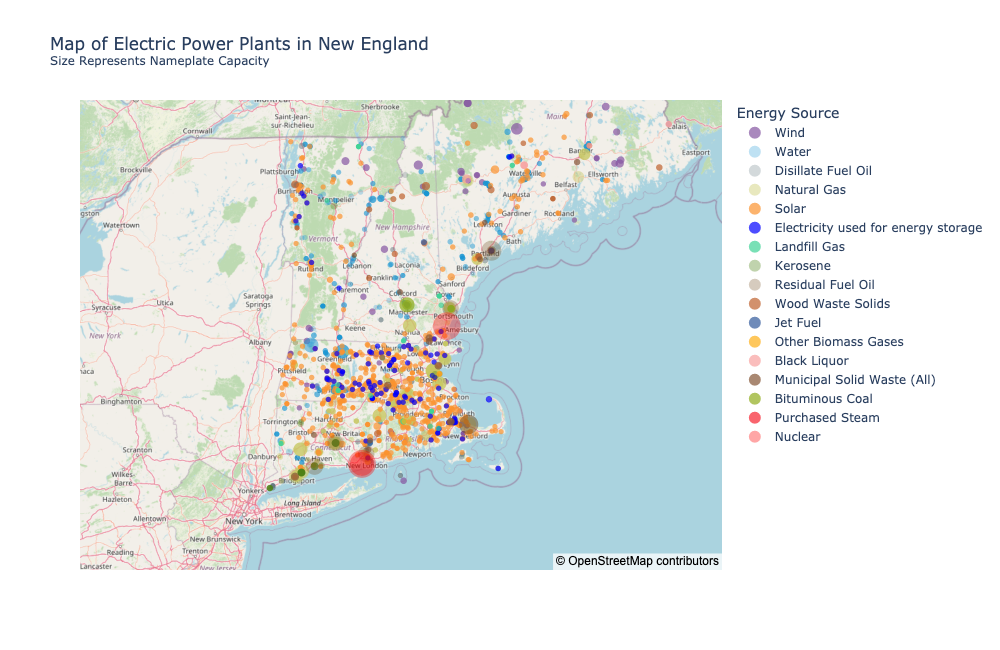
Here are an interactive map and a static map showing of all of the electric plants in New England.
 .
.
This is the code I used to generate them:
data_getter.map_electric_plants(facets={'stateid':['MA', "NH", "CT", "ME", "VT", "RI"]}, mapbox=False, open_street=True,
                                open_street_file_name="open_street_NE_electric",
                                static_fig_title="Map of Electric Power Plants in New England<br><sup>Size Represents Nameplate Capacity</sup>",
                                dynamic_fig_title="Map of Electric Power Plants in New England<br><sup>Size Represents Nameplate Capacity<br>(hover for details)</sup>",
                                init_zoom=5.5)
Note that I lowered the initial zoom level to fit most of region.